UpviseJS User Interface Guide
UpviseJS provides 4 essential classes to create a portable, efficient and optimized User Interface on mobile and web :
- The List class enables you to create list views, read-only & editable forms
- The Toolbar class allows you to set a title, add action buttons and define tabs for the current screen.
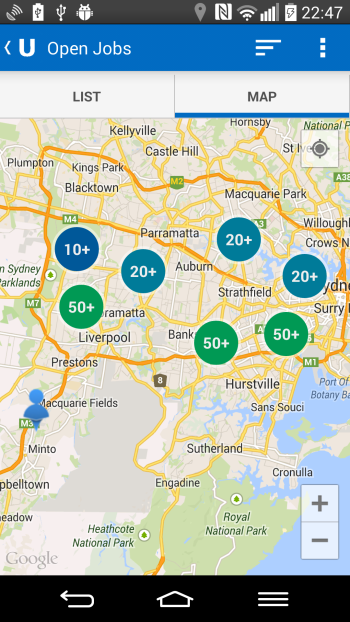
- The Map class displays a zoomable map with clickable markers and real-time user position
- The Chart class displays bar, line and pie charts
All These classes are implemented natively on each platform and comply with the UI guidelines of each platform giving you a native look & feel and great performance.
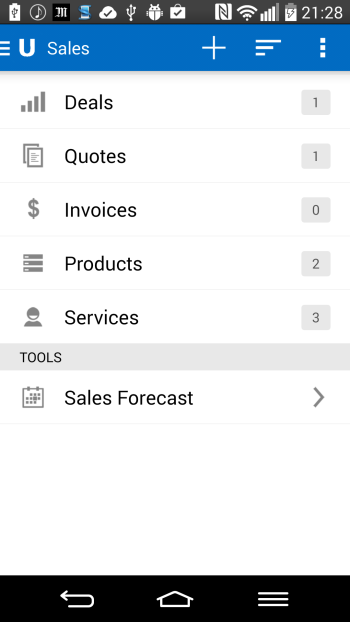


Pages & Navigation
A page is usually contained in to one javascript function, with a set of calls to the
Toolbar object and the List object.
It ends with a List.show() call, which computes, layout and displays the screen.
To pass parameters between pages, simply add them to your function call in the List.addItemXXX() method calls. Use the string interpolation feature of UpviseJS to easily write your callback function
function page1() {
    var myid = "5436";
    List.addItem("Goto Page2", "page2({myid})");
    List.show();
}

function page2(id) {
    List.addItem("ID: ", id);
    List.show();
}
List View Screen
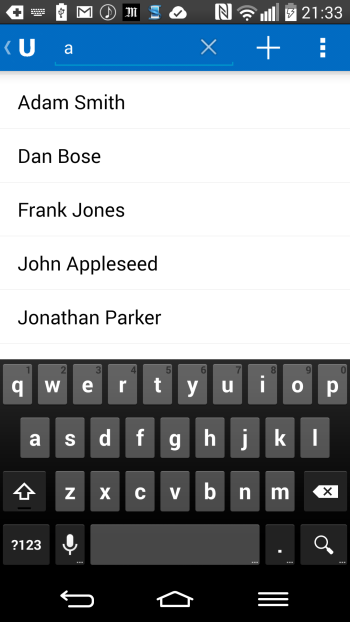
A list view screen usually contains a list of similar items.
- Use the List.addItem(title, onclick) to display a simple label
- Use List.addItemSubtitle(label, subtitle) to add more information. subtitle is displayed in the a smaller gray font
- Use Toolbar.setStyle("search") to add a search icon on mobile to enable built-in filtering support
- List View screen could also be used to as Home screen or welcome screen on phones, to present a first set of sub screens.
function welcome() {
    List.addItem("Customers");
    List.addItem("Support Tickets");
    List.addItem("Quotes");
    List.addItem("Product Catalog", "productlist()");
    List.show();
}

function productlist() {
    Toolbar.setStyle("search");
    for (var i = 0; i < 100; i ++) {
        List.addItemSubtitle("Product " + i, "in stock");
    }
    List.show();
}


View Screen
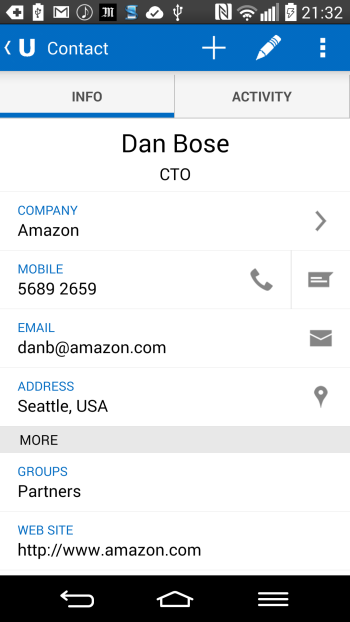
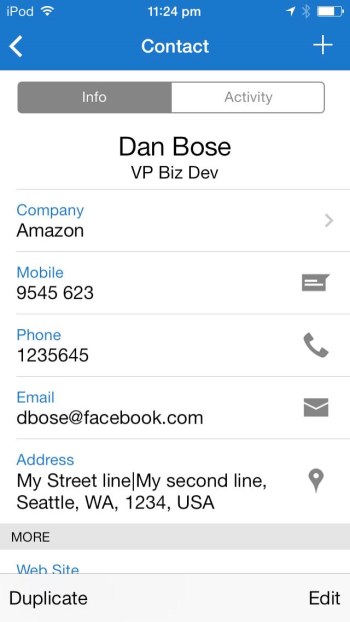
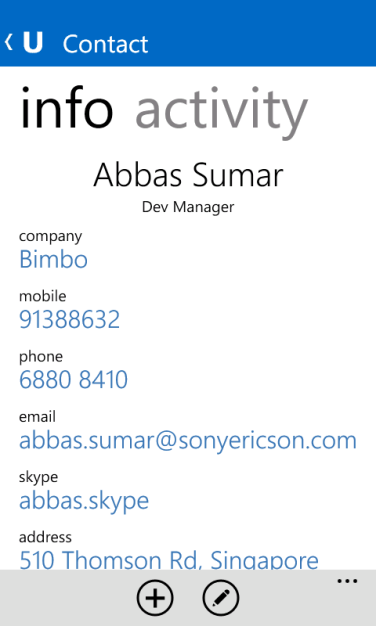
A view screen usually presents read-only information related to a record, for example a view lead screen would show the lead name, email, phone.
- Use the List.addItemLabel(label, value) to display the label and value for the field.
- Use the List.addHeader(title) to add a gray separator header to group items logically
- You can use List.addItemTitle(title, subtile) to display a big centered title and subtitle at the beginning of the list
- You can make some list items clickable and perform some action such as starting a phone call. See App class for available integration.
- Add an Edit button in the Toolbar using Toolbar.addButton(title, onclick, style). Specify style="edit" to display an edit icon.
function viewLead(id) {
    .....
    Toolbar.setTitle("Lead Info");
    Toolbar.addButton("Edit Lead", "editLead({id})", "edit");
    List.addItemTitle("John Smith", "Vice President");
    List.addItemLabel("Mobile", "6878 8585", "App.call({this.value})");
    List.addItemLabel("Address", "1 Redmond Way, Seattle", "App.map({this.value})");
    List.addHeader("More");
    List.addItemLabel("Birthday", Format.date(13845566));
    List.show();
}

Edit Screen
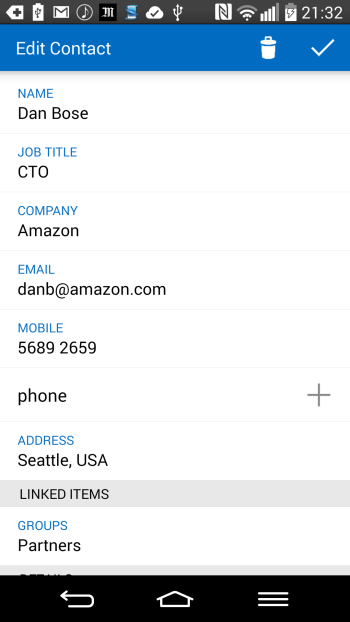
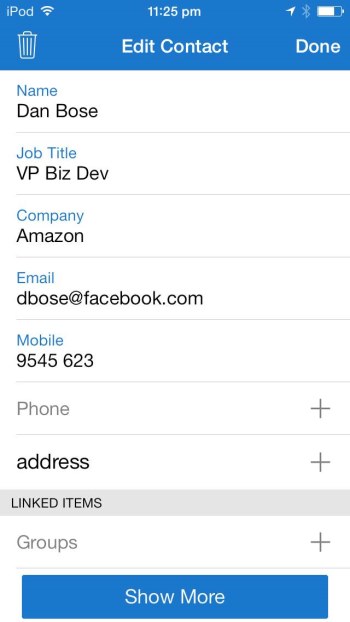
an Edit screen is usually called from a View screen using a toolbar action button. Edit screens looks similar to View screen with the following differences:
- The Toolbar usually displays a Done or check button instead of the back button. Use Toolbar.setStyle("edit"). This is a pure UI change, as the done button will still perform a regular back navigation
- It is recommended to indicate in the toolbar title that this is an edit screen, for example "Edit Product"
- Each list item when clicked, should be editable
To edit a text, date, time, number, use the List.addTextBox(id, label, value, onchange, type) method. To edit a value selected amongst a fixed set, use
List.addComboBox() or List.addComboBoxMulti().
You can also use List.addCheckBox() to change a boolean value
function editLead(id) {
    var lead = Query.select("leads", id);
    Toolbar.setTitle("Edit Lead");
    Toolbar.setStyle("edit"); // this change the back button to Done in the toolbar

    var onchange = "Query.updateId('leads',{id},this.id,.this.value)";
    List.addTextBox("name", "Name", lead.name, onchange, "text");
    List.addTextBox("email", "Email", lead.email, onchange, "text");
    List.addTextBox("date", "Date", lead.date, onchange, "date");
    List.addCheckBox("important", "Important", lead.important, onchange);
    List.addCheckBox("source", "Source", lead.source, onchange, "0:Website|1:Direct Mailing|2:Other");
    List.show();
}
this.id is a keyword, whose value is contextual to the current editable field (the id parameter value of the List.addTexBox() call)
this.value is the new modified value

History management
UpviseJS manages automatically the history stack for you, like in a web browser and provides a Back button to go back to the previous page. There is also a Refresh menu item to reload the current page.
You can also control and change the way the framework add pages to the history using the History.redirect(funcall) method. This is useful when you do not want certain function call to be part of the history (when creating a record for example). Use the History.back() method to programmatically go back when you implement a delete record function.
function newLead() {
    var id = Query.insert("leads", {date:Date.now(), owner:User.getName()});
    // Replace the default newLead() history state by editLead
    History.redirect("editLead({id})");
}

function editLead(id) {
    // edit the Lead
}
Working with Tabs
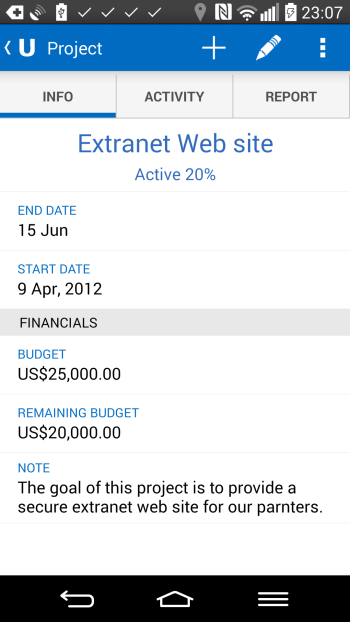
Use Toolbar.addTab(title, onclick) to add
tabs to a screen.
To support both phone, tablet and web, with the same code,do not to use more
than 3 tabs, because of screen width of smartphones.
function viewContacts(tab) {
    var contacts = Query.select("Contacts.contacts", "id;name;geo", "name");
    Toolbar.addTab("List", "viewContacts()");
    Toolbar.addTab("Map", "viewContacts('map')");
    if (tab == 'map') {
        for (var i = 0; i < contacts.length; i++) {
            var contacts = contacts[i];
            Map.addItem(contact, contact.geo, "viewContact({contact.id})");
        }
        Map.show();
    } else {
        for (var i = 0; i < contacts.length; i++) {
            var contacts = contacts[i];
            List.addItem(contact.name, "viewContact({contact.id})");
        }
        List.show();
    }
}
Working with Maps
...
Map.addItem("San Fransisco", "37.769099,-122.425584", "viewCity()");
Map.addItem("Paris", "48.859875, 2.347060", "viewCity()");
Map.addUsers(); // add the real-time position of all users on my account
Map.show();

Displaying Charts
UpviseJS supports drawing charts or type bar, pie and line with the Chart class
- Make one or more Select Queries with Query.select() method to gather the data you want to display
- Use Standard javascript code to crunch the data you want to finally displayed. The resulting data must fit in a table like structure of columns and rows
- Init the Chart class by calling Chart.init() method
- Define the columns for the data structure. Use Chart.addColumn(type, label) for this. type can be "string" or "number". Label is an optional label string to name the column
- Add rows of data by calling multiple time Chart.addRow(value1, value2, ...) . The actual number of parameter and their type mush match the column definitions.
- Call Chart.show(type) to display the chart. type can be "bar", "pie" or "line"
...
Config.tables["leads"] = "id;name;city";
....
// 1. Gather all leads and put them in a hashmap object for each city
var data = new Hashmap();
var leads = Query.select("leads", "city", "city != ''");
for (var i = 0; i < leads.length; i++) {
    var lead = leads[i];
    data.increment(lead.city, 1);
}

// 2. Init the Chart and define the columns
Chart.init();
Chart.addColumn("string", "City");
Chart.addColumn("number", "Number of Leads");

// 3. Add the rows to the chart
for (var i = 0 ; i < data.keys.length; i++) {
    var city = data.keys[i];
    var count = data.get(city);
    Chart.addRow(city, count);
}
// 4. Display the Chart
Chart.show("bar");
The Chart class is not available yet on iOs.

